

TI-84 Plus (CE) Complex Vector Plotting
Complex vector plotting is essential to engineering and physics. In network analysis, phasor diagrams illustrate the amplitude and phase relationships of voltages and currents.
A special TI-Basic program is available to display phasors on your TI-84 screen, showing them both individually and as a vector sum. Before demonstrating the plotting program, we will analyze the electrical circuit to which the phasor diagram relates. The current and all partial voltages are calculated using the TI-84

The electric circuit under analysis consists of a sinusoidal voltage source with an RMS voltage of 120 V and a frequency of 60 Hz. The voltage source is connected to a 130 Ohm resistor and an inductor with an inductance of 0.5 H.


The calculation of voltages and current is shown above. The angle mode is set to radian during calculations and plotting to ensure correct results.
Explanation of the Vector Plotting program (single vectors, or vector sums)
Now that the amplitudes and phases of the voltages and current are known, it is time to plot these quantities in a phasor diagram. The program GRAPHVC2.8XP allows you to visualize these vectors directly on your TI-84 screen. (horizontal real axis,verical imaginairy axis). The steps to generate the phasor diagrams are outlined below. By plotting and summing the vectors VR1 and VL1, the resulting vector represents the source voltage V1.
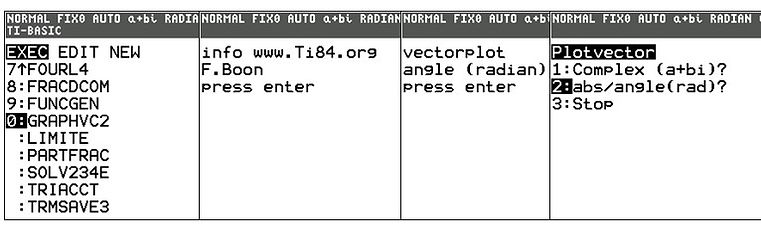
The first step is to launch the program GrAPHVC2.8XP. The program will prompt you to choose an input method: complex (a+bi) or amplitude and angle, as well as the number of vectors to be plotted.
Finally, the program asks whether to display the individual plots or the sum of the vectors; in this case, we select the sum. The final result is approximately 120V with an angle of 0 radians, which confirms the calculation is correct.


The voltage VR1 has a phase lag of 0.9595$ radians (-55 degrees) relative to V1. VR1 and VL1 are perpendicular, and their vector sum is V1 = 120V.
Download the program. Questions? Mail to ti84.org@gmail.com