

The Bode diagram with the Ti-84 Plus (CE) page 1
Advertisements help cover our hosting costs and ensure our programs remain free for everyone
Explanation of the Bode diagram program : P-control
The Bode diagram is useful for determining the stability of a control system (phase margin and gain margin). It is an important subject in Electrical and mechanical Engineering. With this Ti-84 Basic program, the Bode diagram is plotted to determine for example the proportional gain for a desired phase margin or gain margin. As a case, a speed control system is analyzed, of which the proportional gain for a phase margin of 60 degrees has to be determined. This phase and the gain margin are determined of an open loop system, See the figure below. The example is related to a real existing drive system at Avans University.

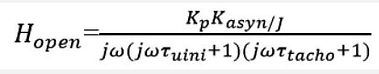
For Kp=1 the Bode diagram of Hopen is plotted, Kasyn=2.071Nm/A, J=0.018887kgm^2,
tauuni=10msec , tautacho=1msec.
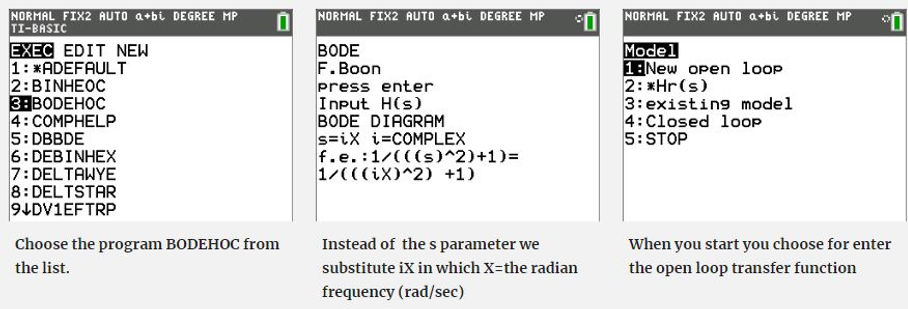
The Bode Program menu has 5 options.
1: New transfer function open loop= Hs
2: The open loop function * Controller = H(s)*Hr
3: existing model is used for adapting the scaling of the axes
4: Closed loop =(Hs*Hr/(1+Hs*Hr)
5: Stop
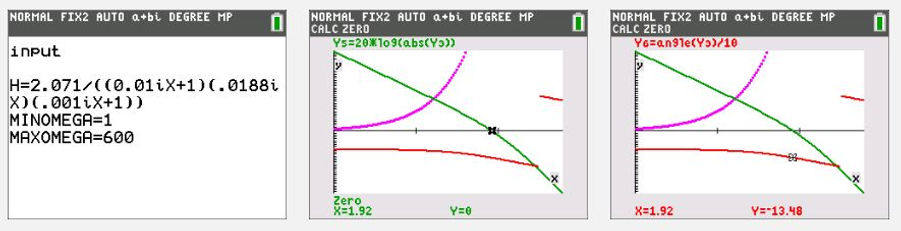
Open loop transfer function. Green= amplitude, Red=phase/10 (to fit in the same screen as the amplitude). At 0 dB the phase=-13.48*10=-134.8 degrees. Which is a phase margin of 180-134.8=45.2 degrees


To achieve 0dB of total gain, the gain Kp should be -5.65 dB =10^(-5.65/20)=0.52. The corresponding frequency equals 51.12 rad/sec.
If a P-control is added by inserting Hr(s)=0.52, and we run the program Bode again, then 0dB gives a phase margin of 180-120-= 60deg phase margin. See figures below. Remember that the real phase has to be multiplied by 10 (12*10=120deg). The corresponding frequency = 51.12 rad/sec, which = 10^1.71

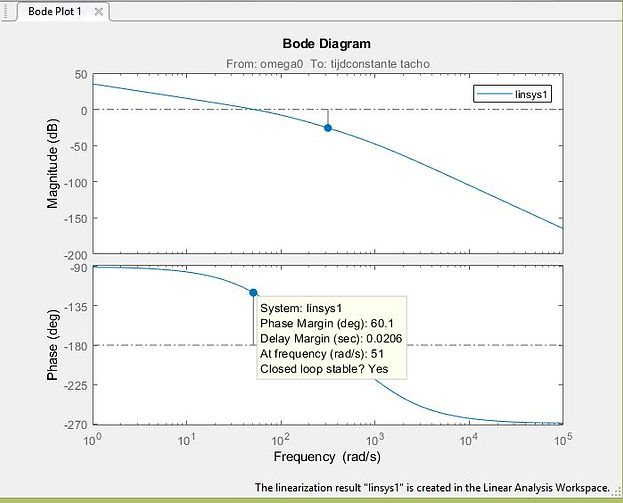
A check with Simulink (Matlab) gives the same result, for Kp=0.52 there is a phase margin of 60.1 degrees at a corresponding radian frequency of 51 rad/sec